Introduction of the Meteo plugin
Aximmetry's Meteo plugin is a versatile tool capable of displaying 3D maps, selections, and a multitude of animated overlays suitable to weather forecast and educational productions all while can be easily integrated into any virtual scene. This document will introduce you the most important features of this plugin.

View modes
The Meteo plugin provides useful view modes that are all fully costumizable, offering you the possibility of always having the perfect visual elements to support your message. The 3 key view modes are: - the Grided Data View, which is suitable for grib \ image based data presenting, - the Point Data View is suitable for point data presentation, - the Timeline View is used for presenting summerized data grouped on a time basis.
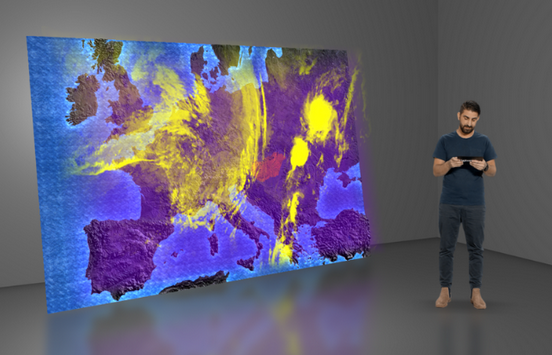
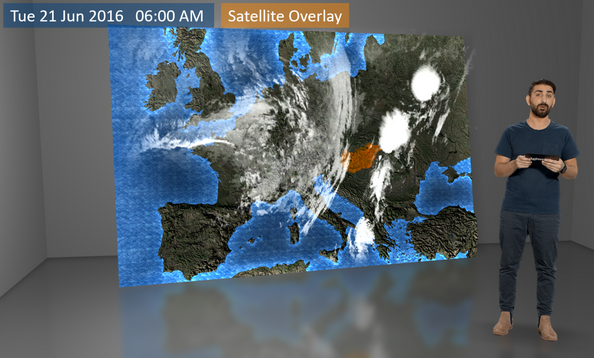
Grided Data View
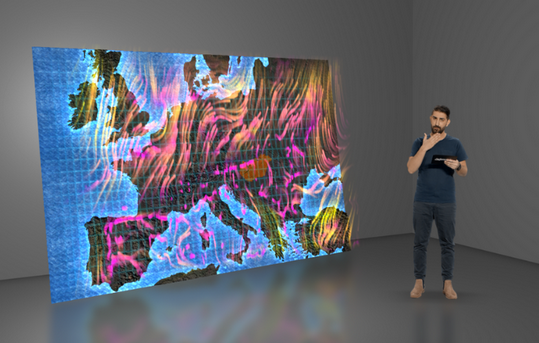
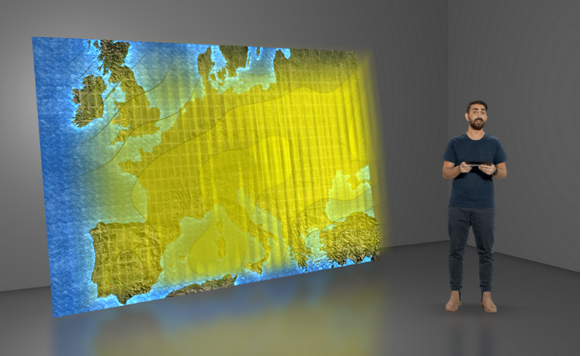
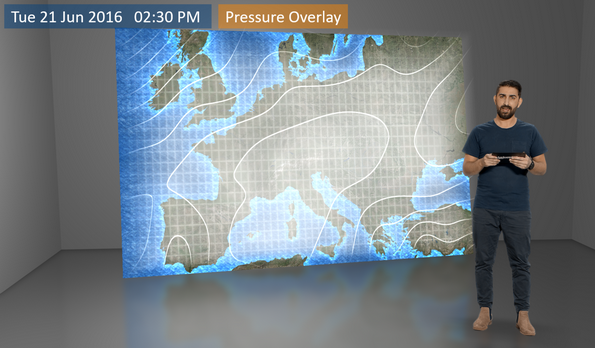
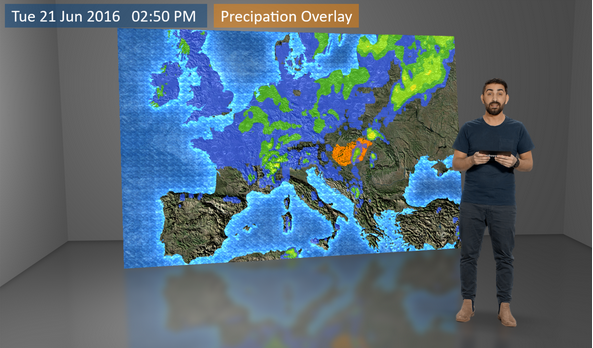
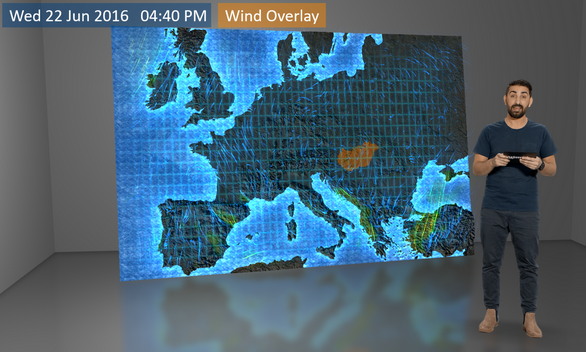
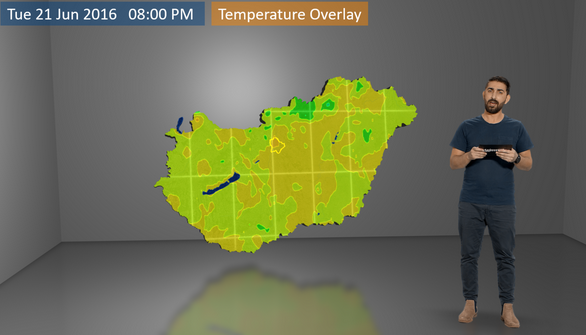
There is a variety of overlay templates used for presenting image and grid-based data, with the ability of using animation, making them able to present change through time. Using our customizable Satellite, Pressure, Precipitation, Wind and Temperature overlay templates the Meteo plugin is capable of displaying various data types.
Satellite Overlay: It is designed to display cloud coverage data with customizable speed, colors, opacity and other settings.
Pressure Overlay: It is designed to display air pressure data with built-in measure units and adjustable minimum and maximum pressure to set the displayed interval. Colors, opacity, speed and additional parameters are also adjustable.
Precipitation Overlay: It is designed to display precipitation data with various color scales (each are fully customizable), adjustable intervals, selectable measure units, and other customizable parameters.
Wind Overlay: It is designed to display wind data such as speed, direction, with customizable speed interval, selectable measurement units, customizable speed, size, intensity, opacity and others.
Temperature Overlay: It overlays temperature data visualized by a customizable color scheme, adjustable intervals, selectable measure units, etc.
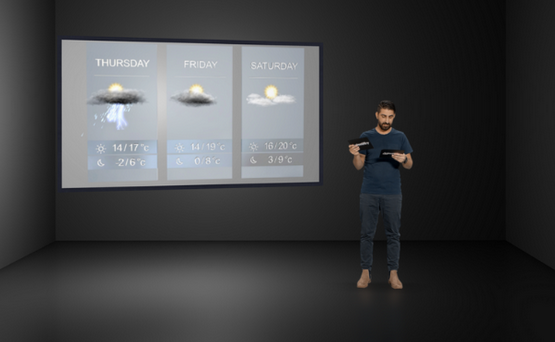
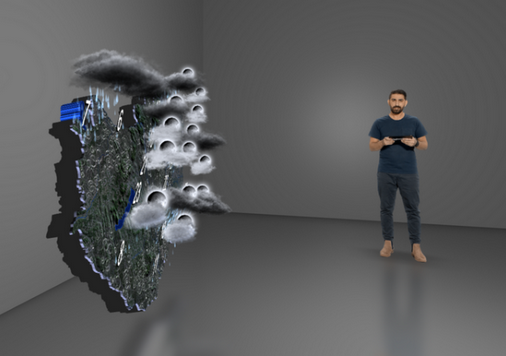
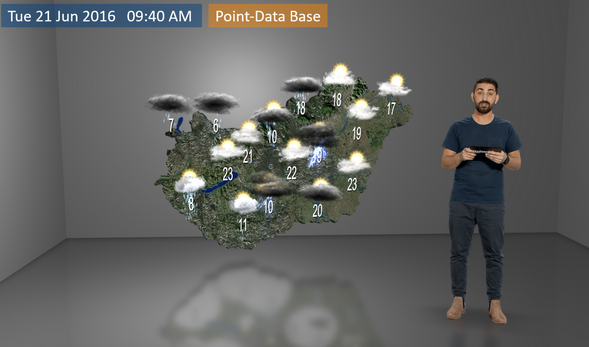
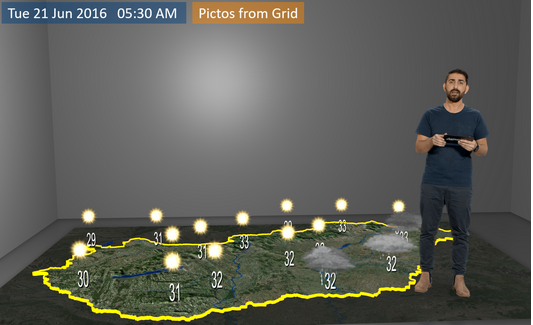
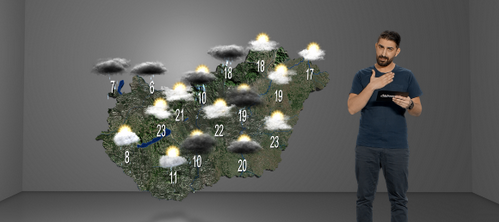
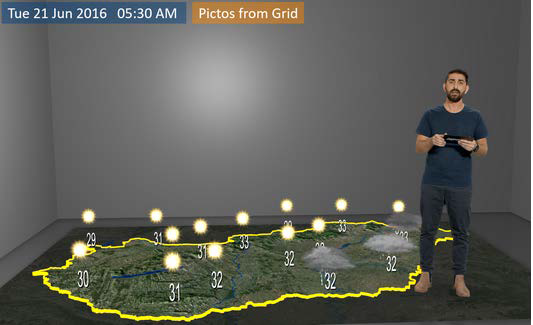
Point Data View
In Point Data View you can visualize geo-coordinate specific data such as temperature, texts, pictograms, etc. for various locations. The pictograms can be images, particle-effects and 3D objects, all of which can be freely animated. Our plugin comes by default with a wide variety of pictograms.
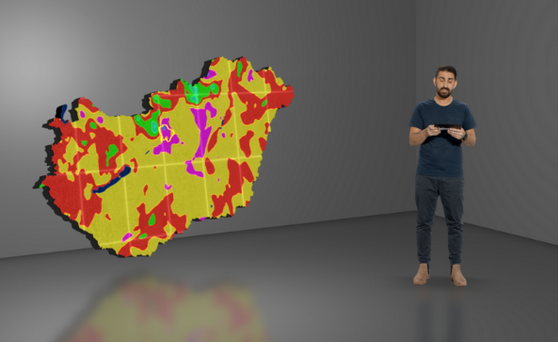
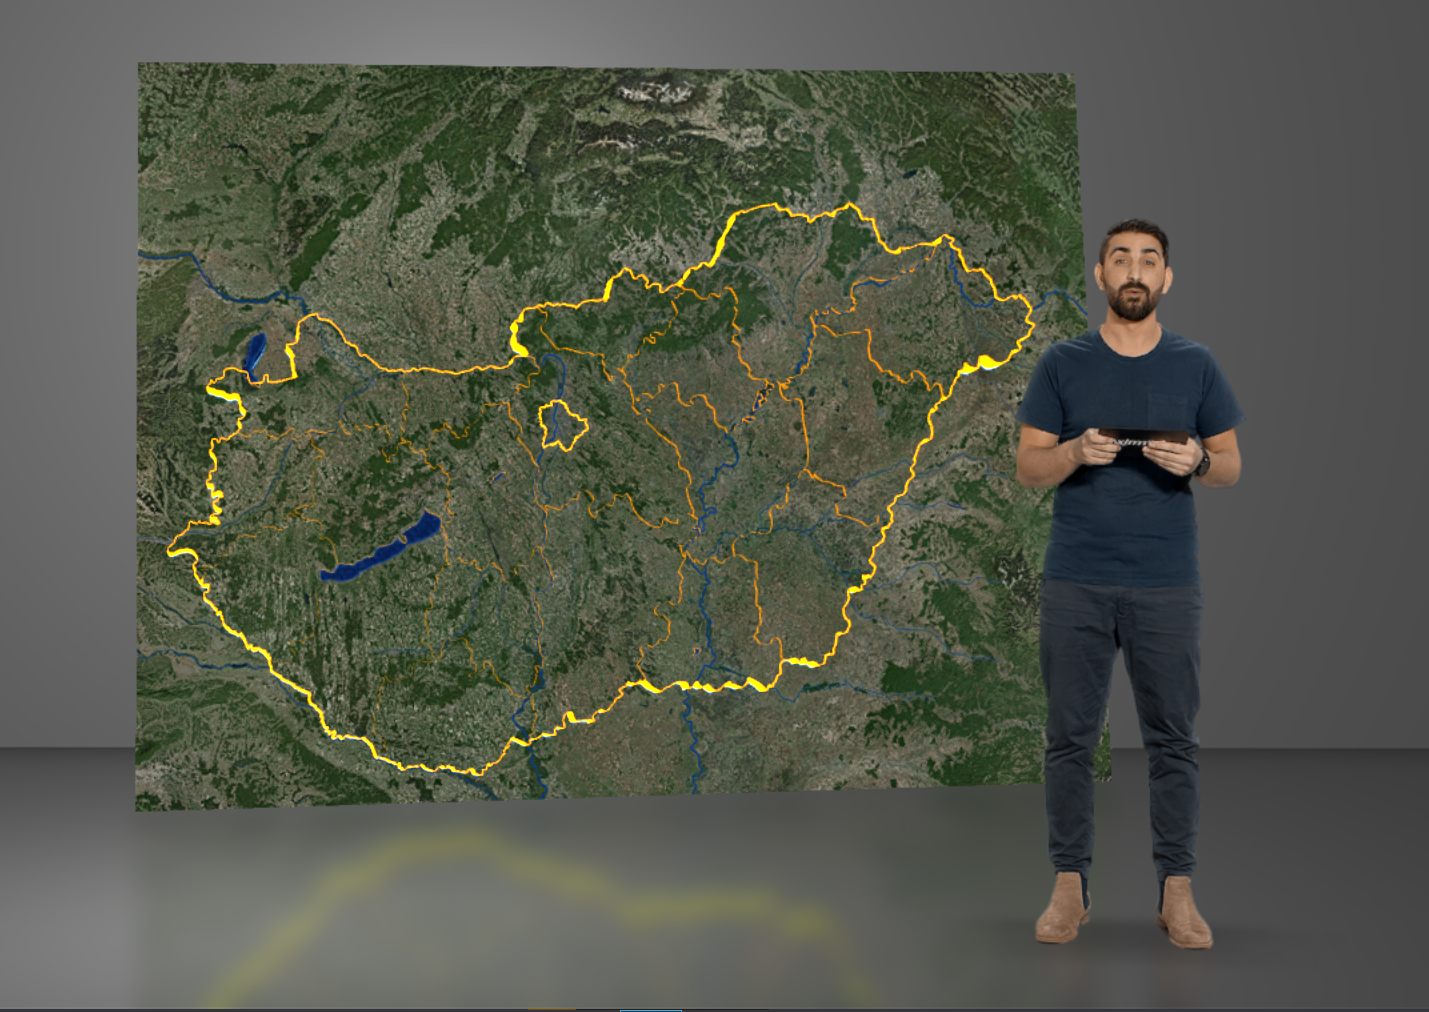
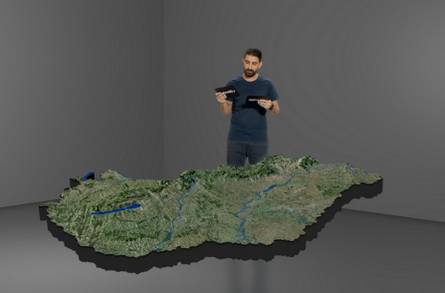
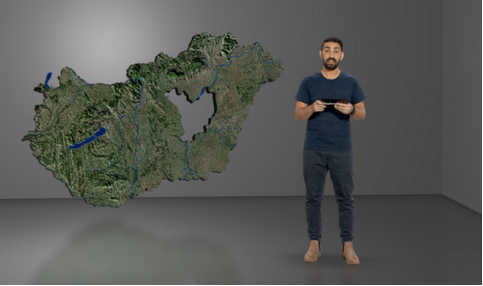
Maps
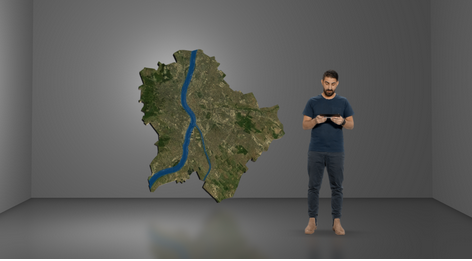
The Meteo comes by default with a map of the 5 continents and a detailed map of Hungary, but you can add any kind of map to it. You can change and manage your library of maps based on your needs.
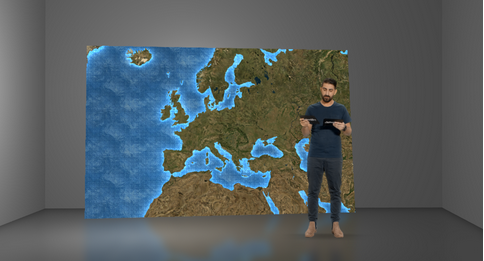

You can choose the maps you want to present and whether you want to present them together or separately.
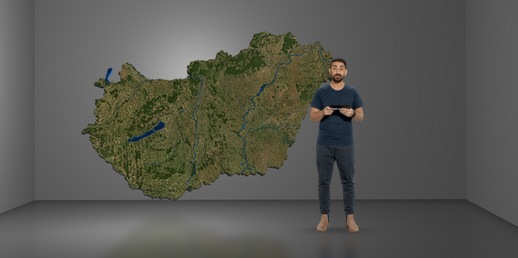
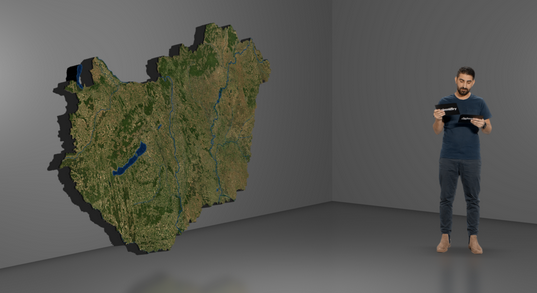
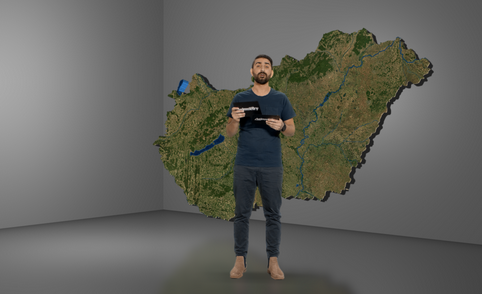
You can rotate and move the 3D map, placing billboards and virtual objects all around it.
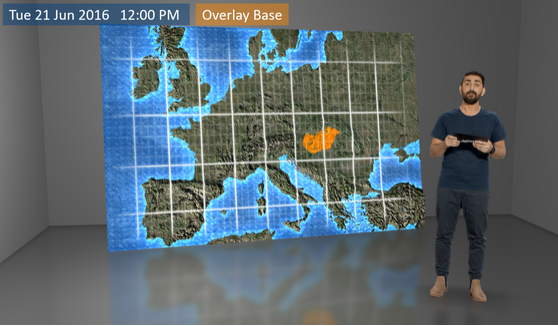
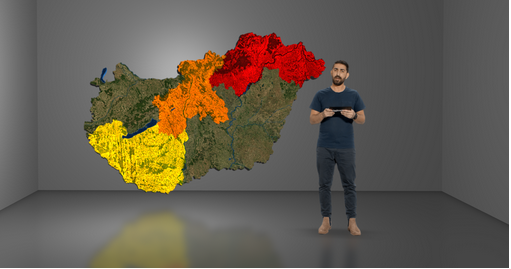
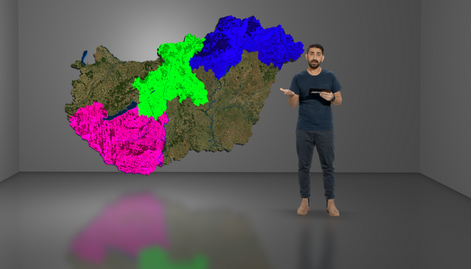
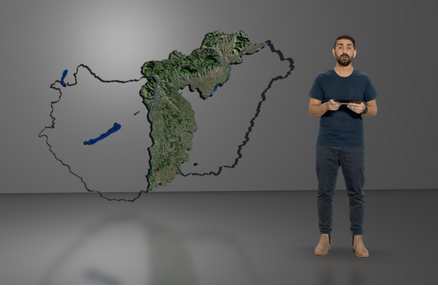
Selections
You can also make selections on the map. For this, the Meteo plugin offers various ways to highlight selected areas of a map. Here are some examples of highlighting borders, and even making them float to further accentuate them.
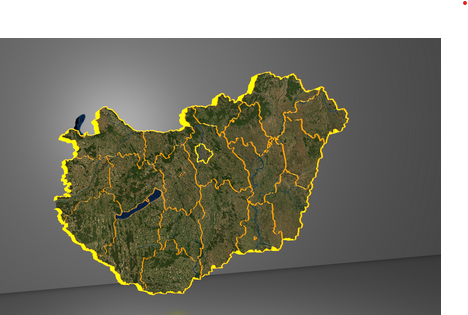
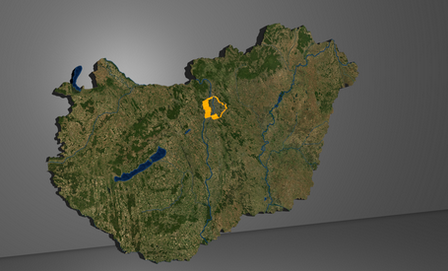
With the ability of coloring the selected areas, you can add additional meaning to the selection. You can define your own colors and their intensity based on your needs.
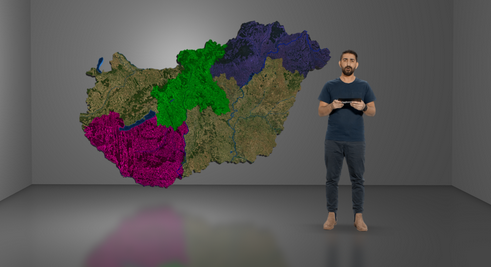
Other than selecting, you can also deselect areas on the map.
Examples of customization